Seth LeBlanc
The code used to make these curves was created by Dr. Scott Rodney, CBU.
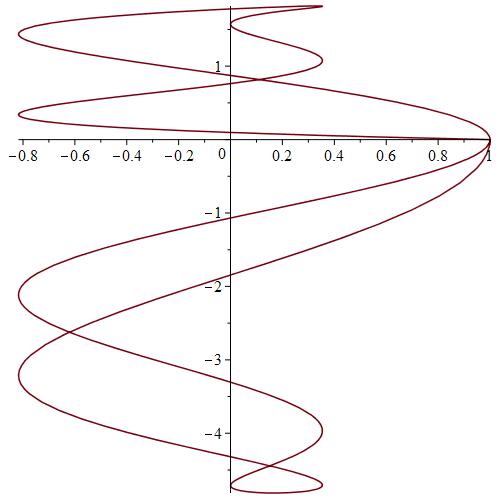
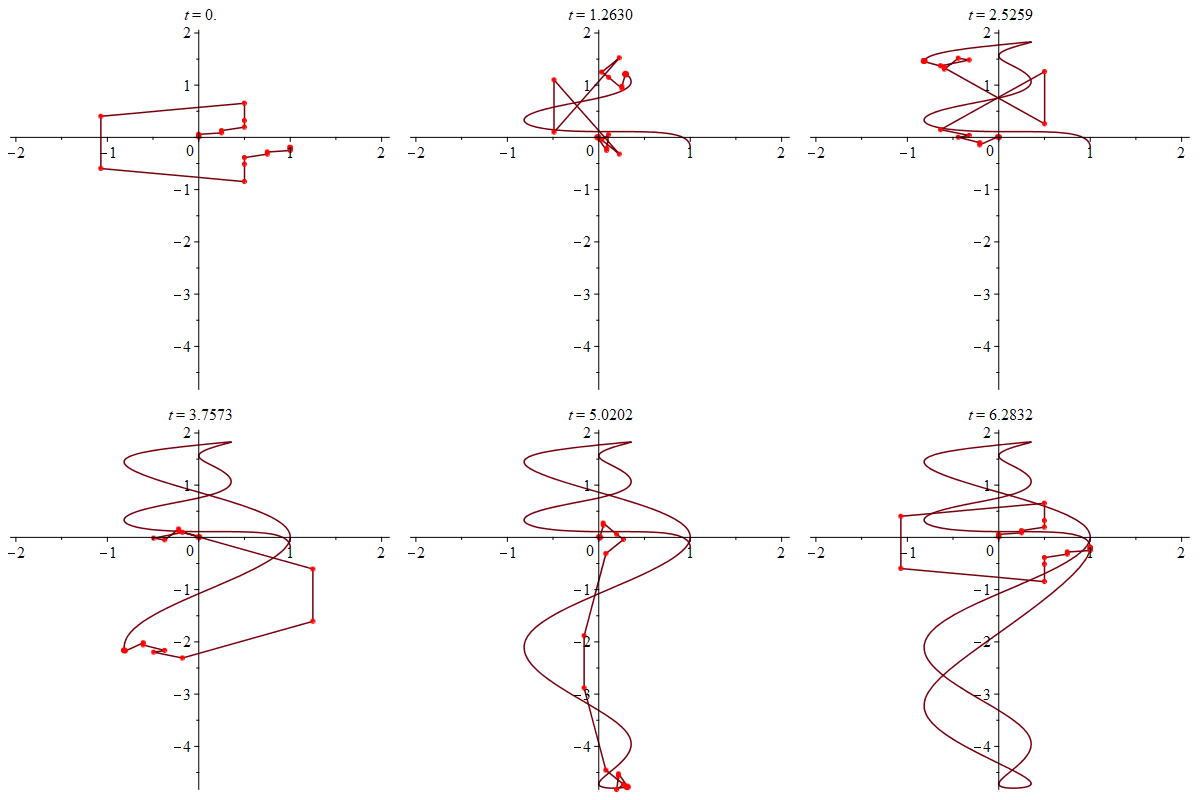
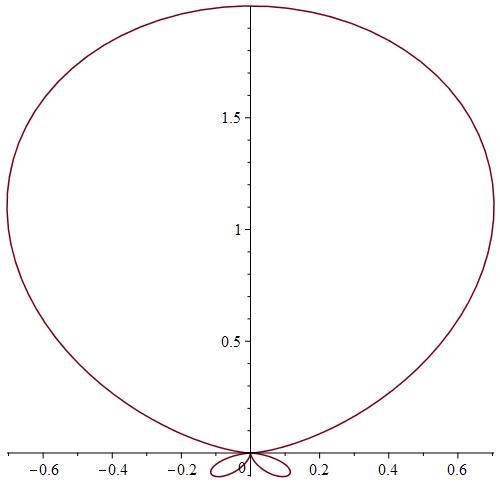
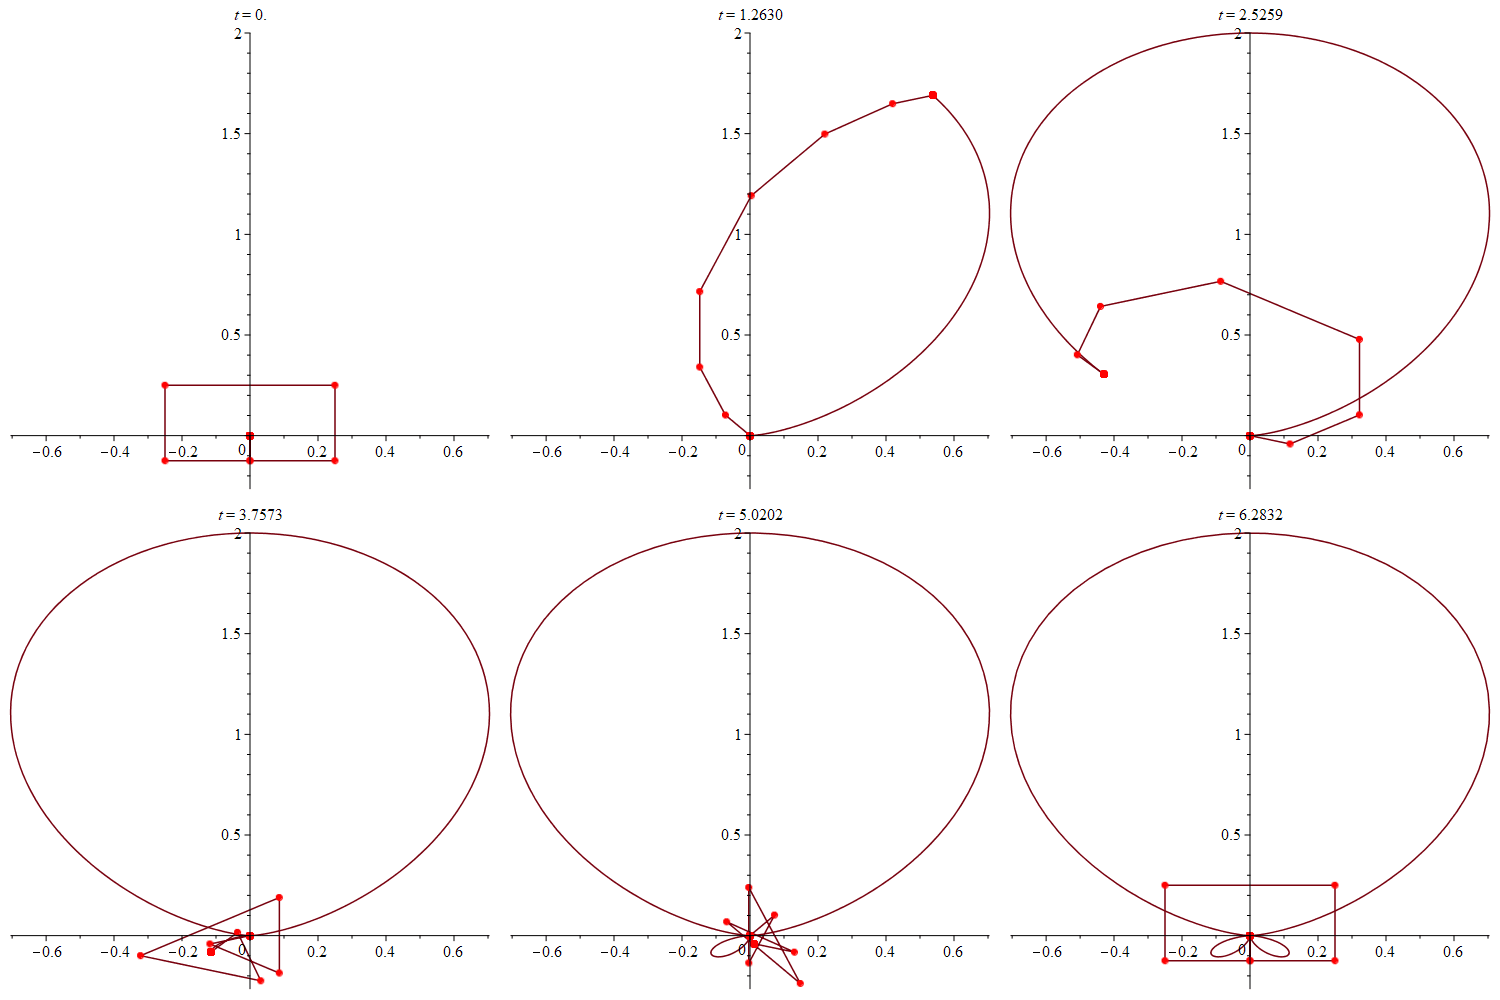
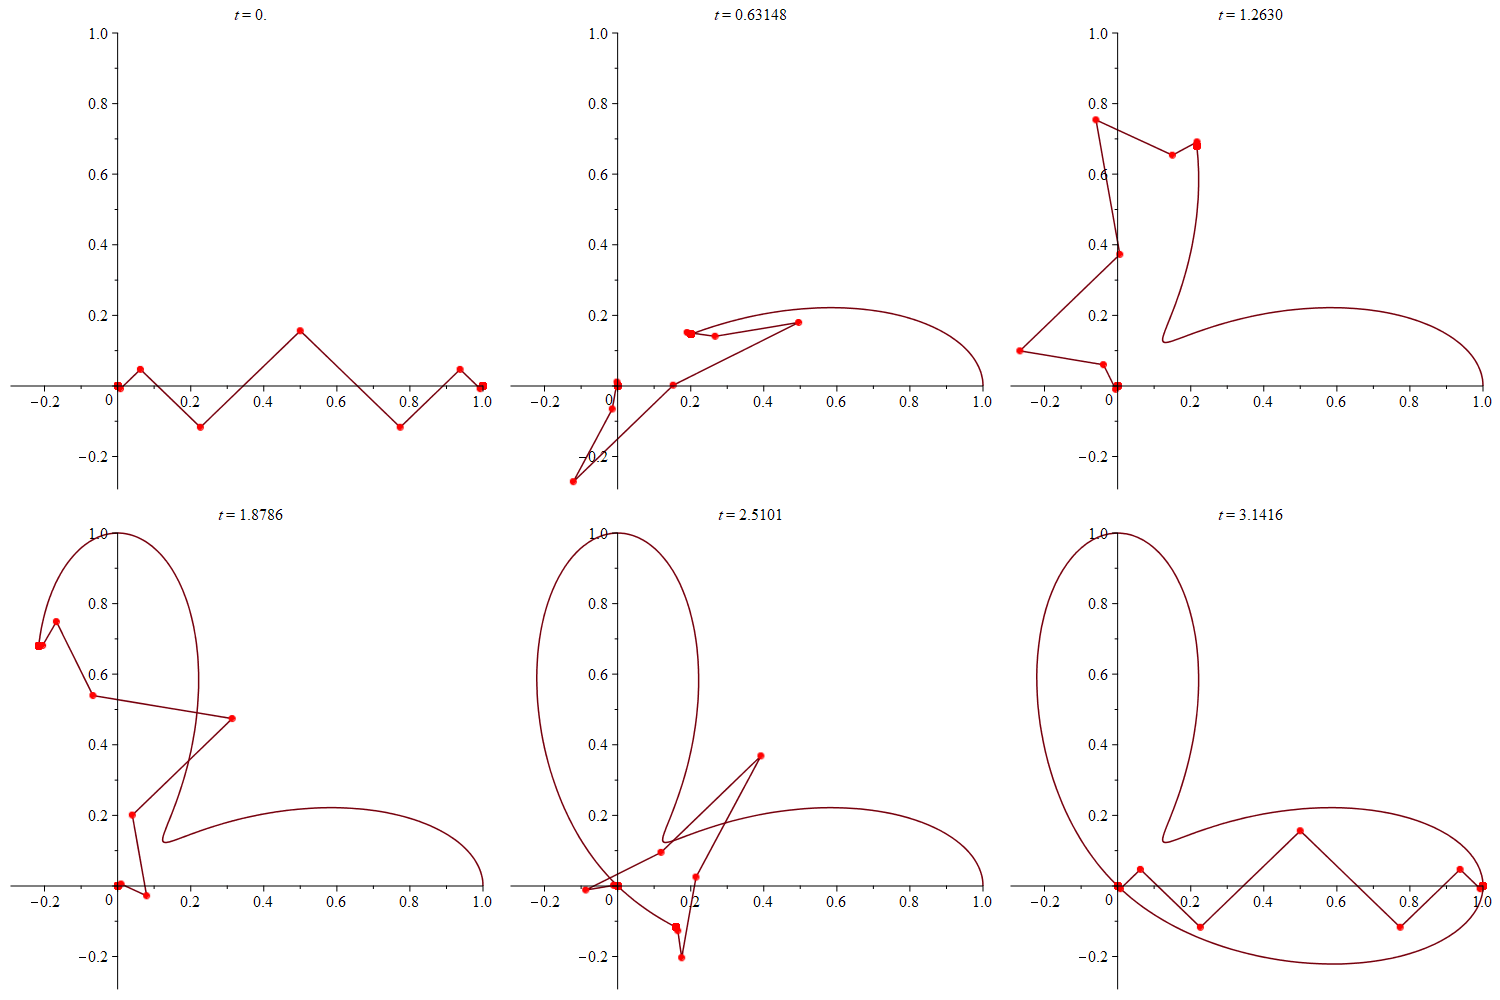
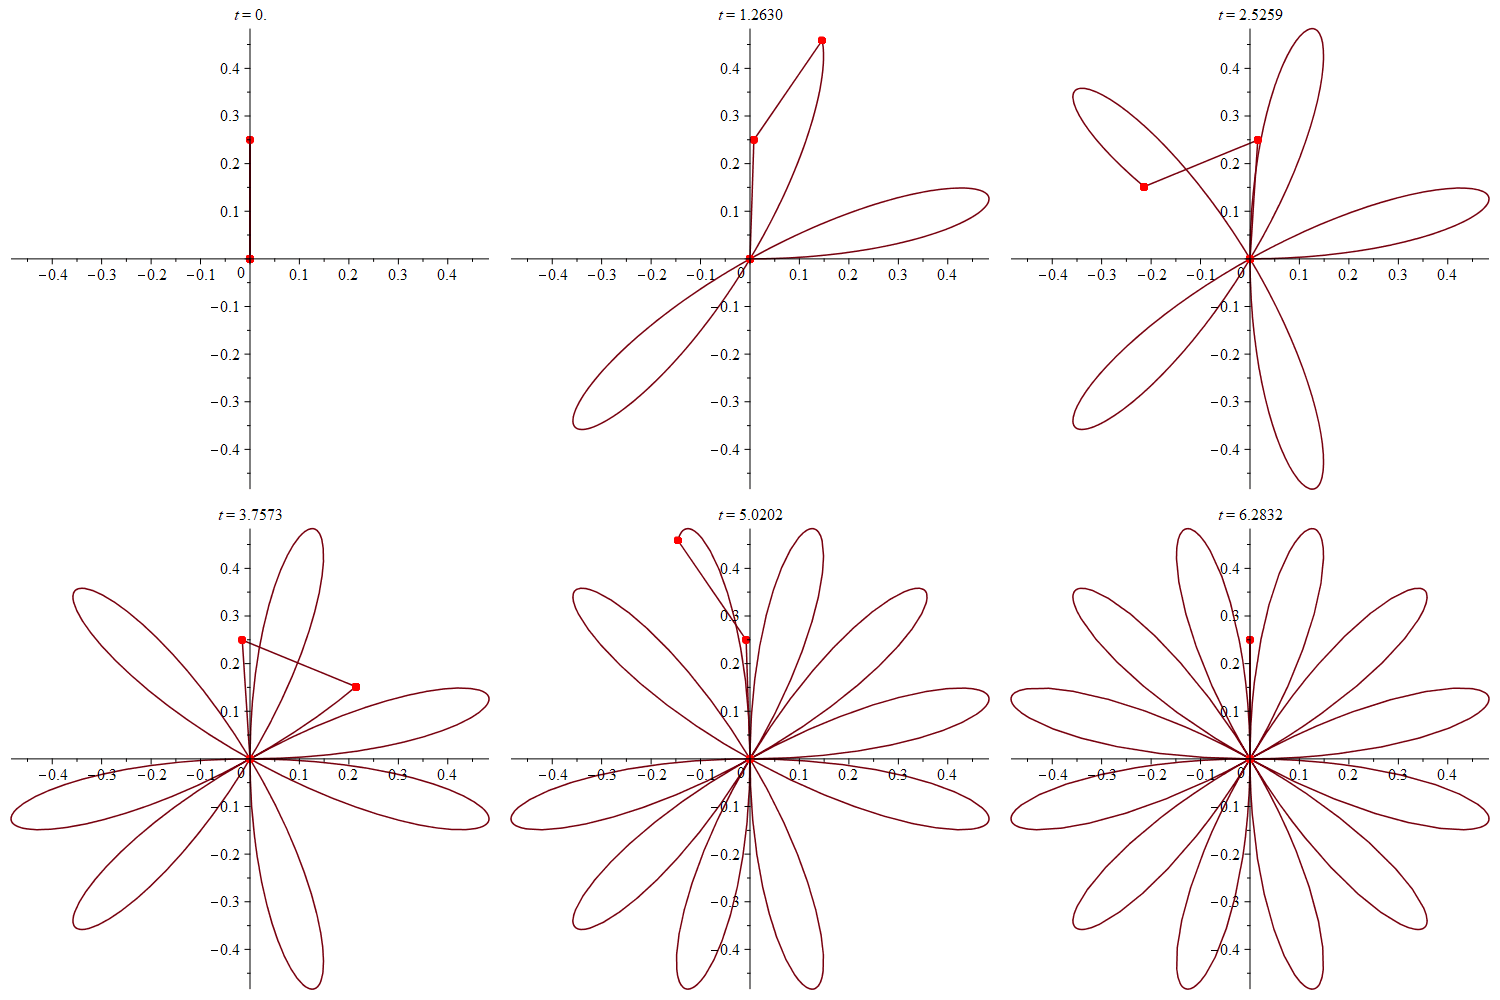
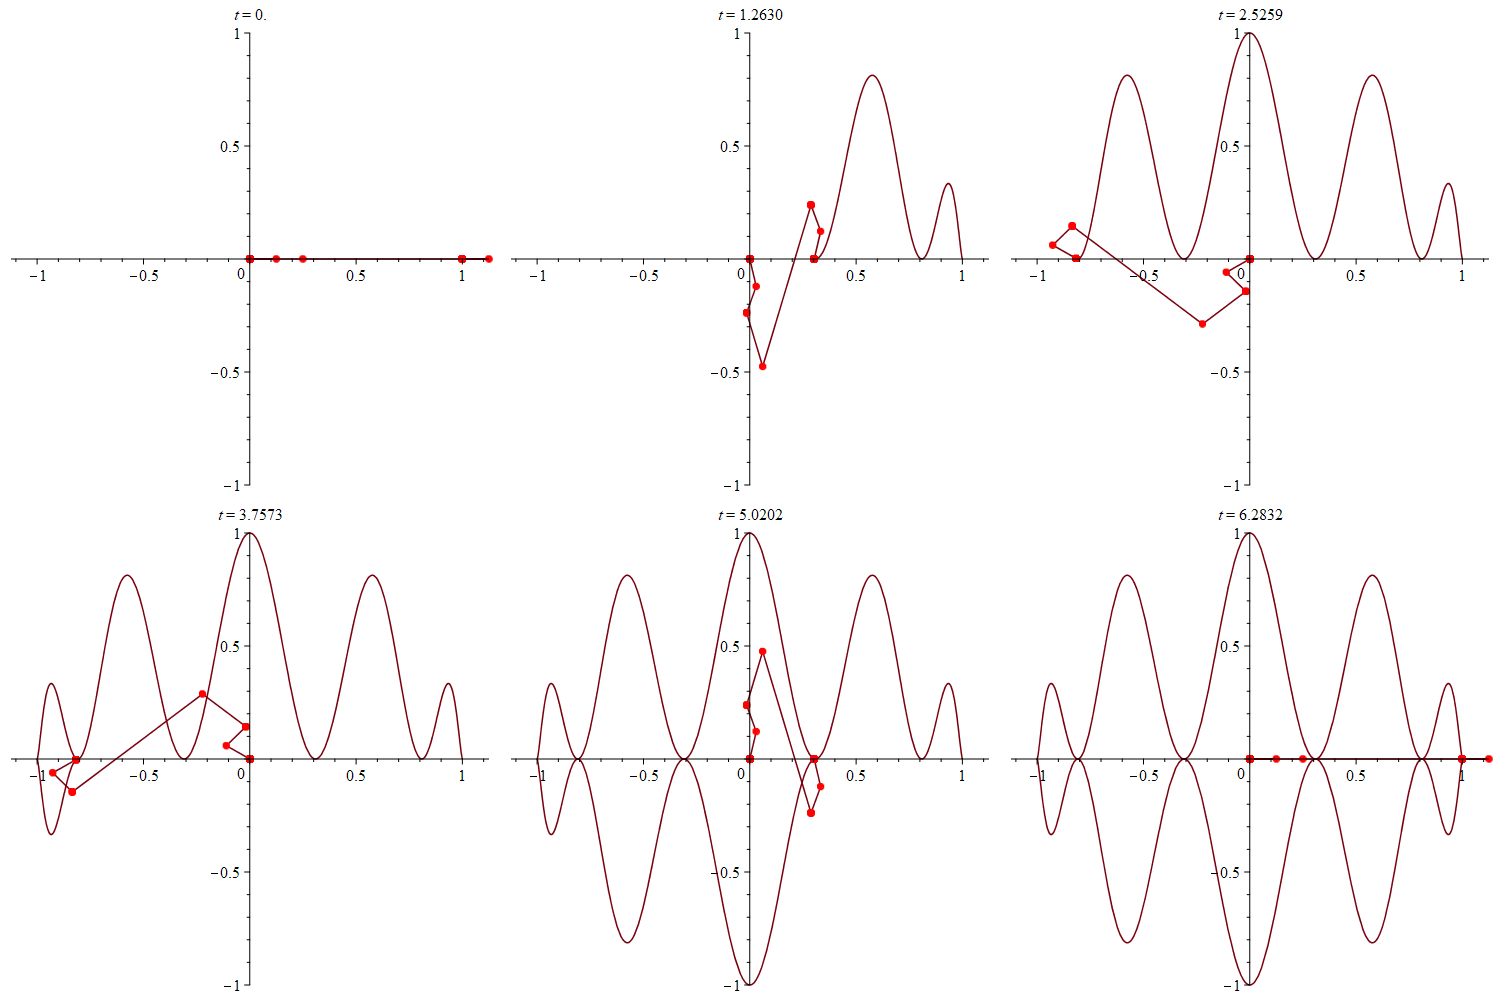
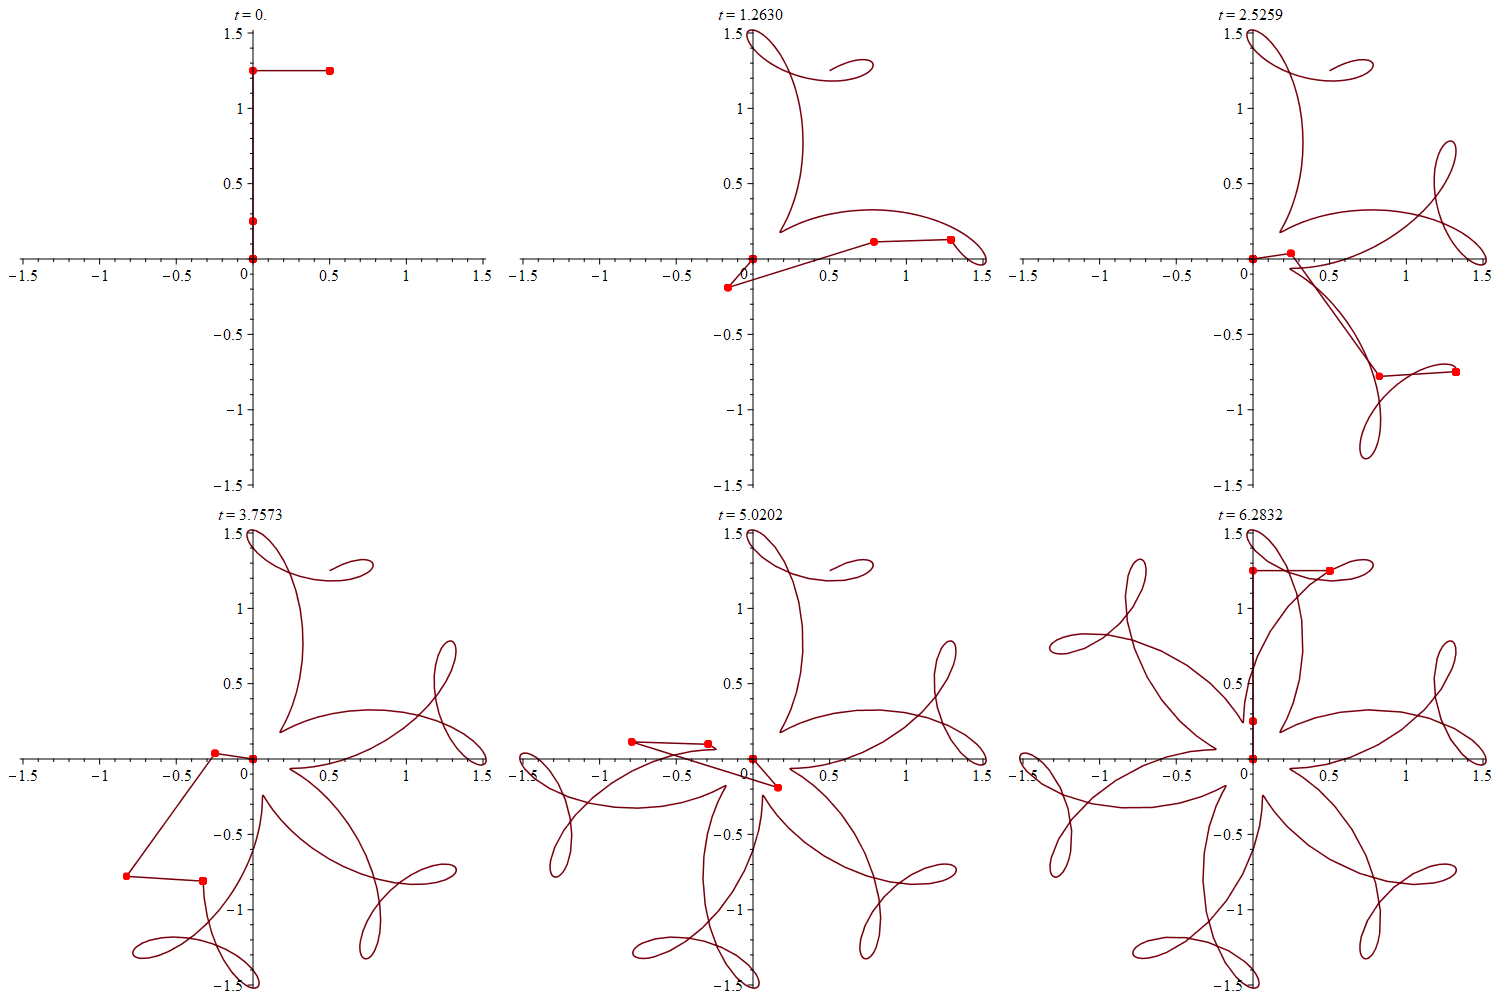
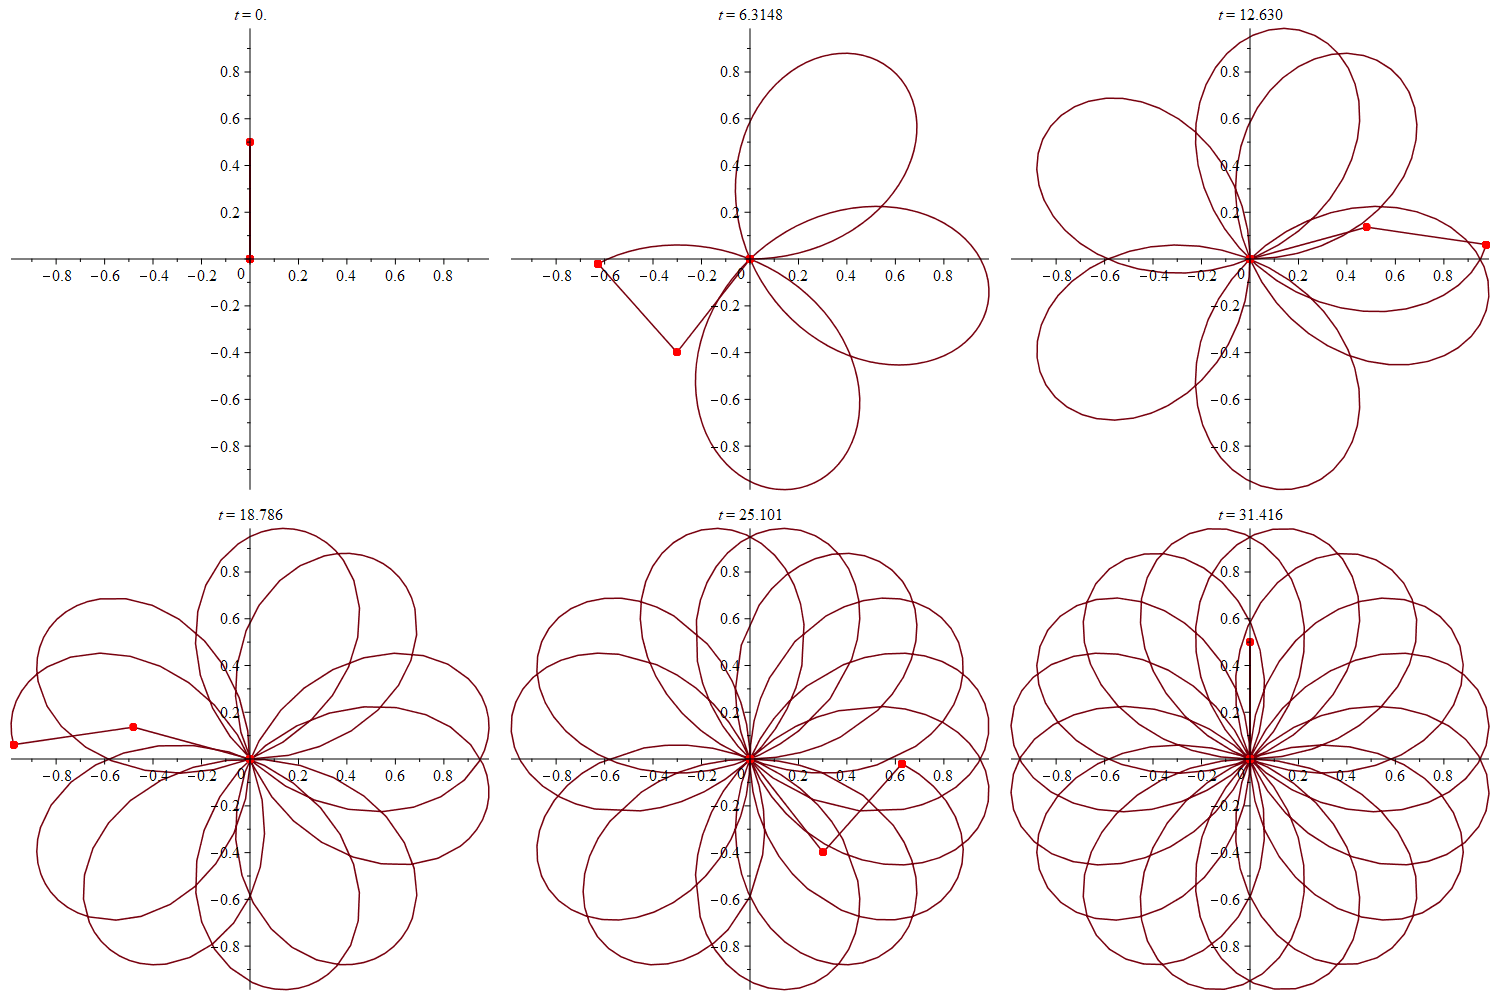
Below is a bunch of parametric cuves being traced by a partial sum (or full sum if finite) of the curve's Fourier series. Each node stemming from the origin represents a successive term in the series. For example, the last curve includes 21 points for the partial sum, as 10 was selected for the partial sum. That is, n=-10, -9, -8,. . .8,9,10, giving a total of 21 points.
First curve . . .
x = cos(t) (sin3(t)+sin2(t)) and y = sin(t) (sin3(t)+sin2(t)) where
2π ≥ t ≥ 0.
Second curve. . .
x = cos(t) (sin4(t)+cos4(t)) and y = sin(t) (sin4(t)+cos4(t)) where
2π ≥ t ≥ 0.
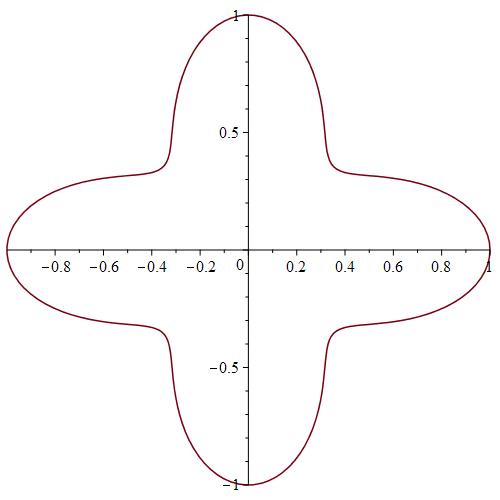
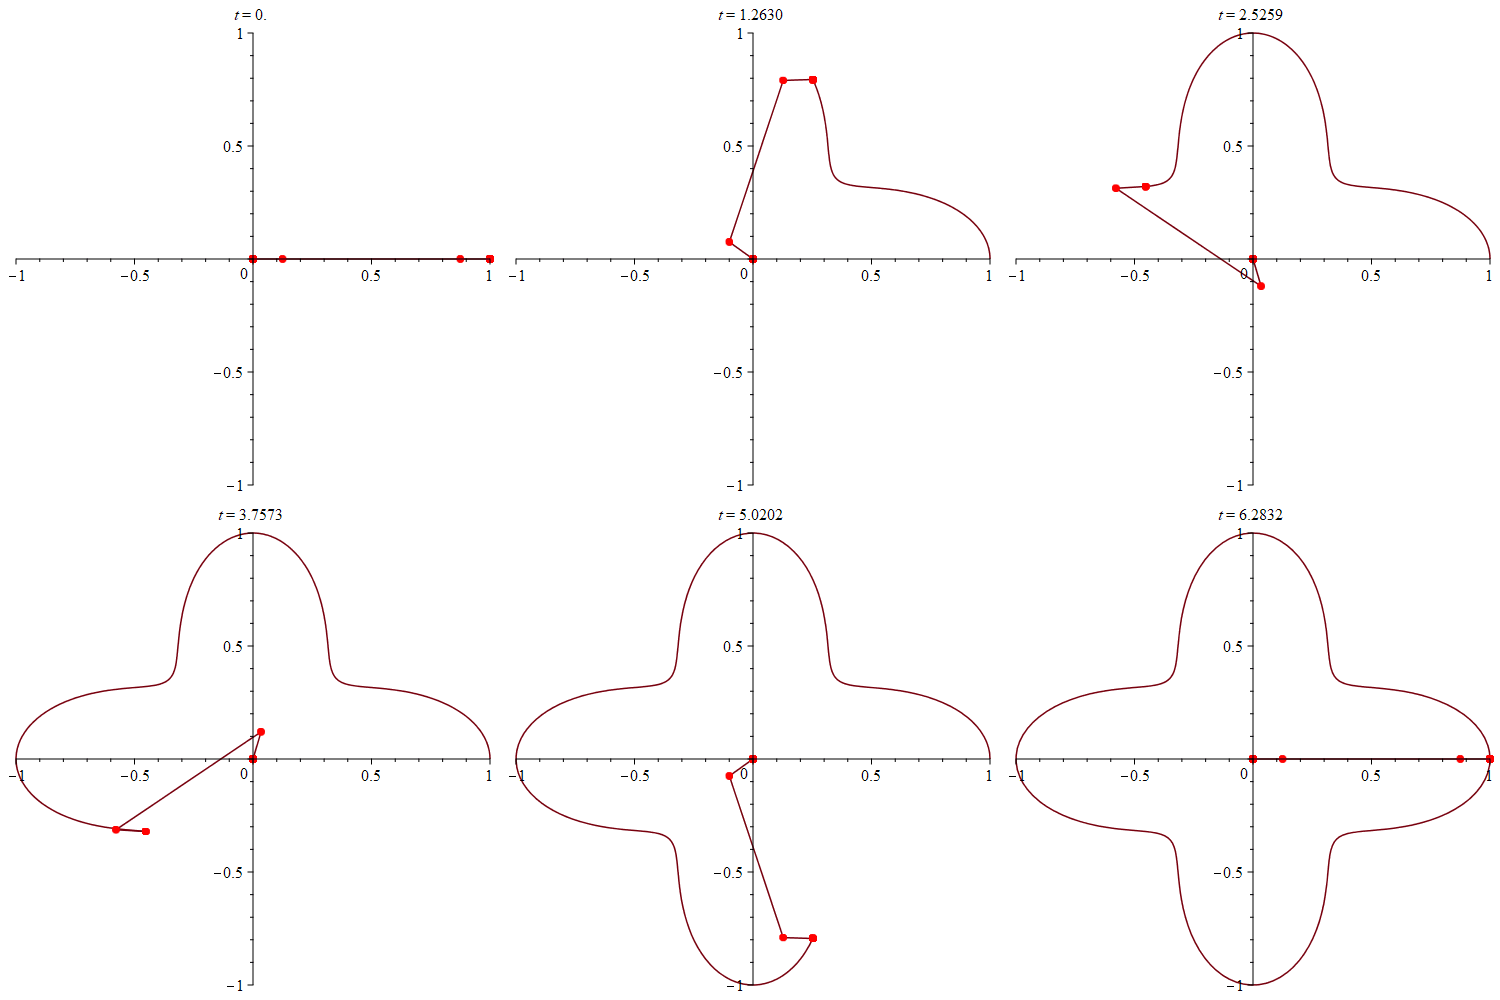
Third curve . . .
x = cos(t) (sin6(t)+cos6(t)) and y = sin(t) (sin6(t)+cos6(t)) where
2π ≥ t ≥ 0.
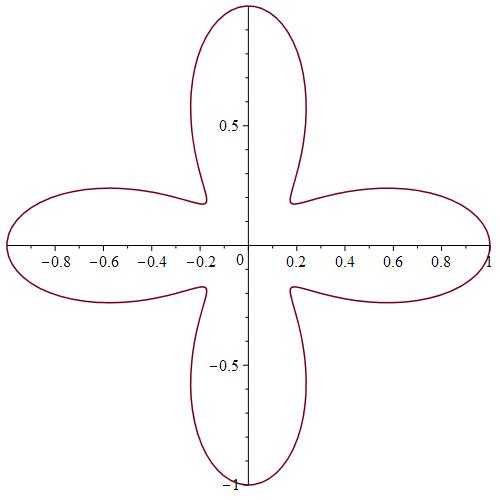
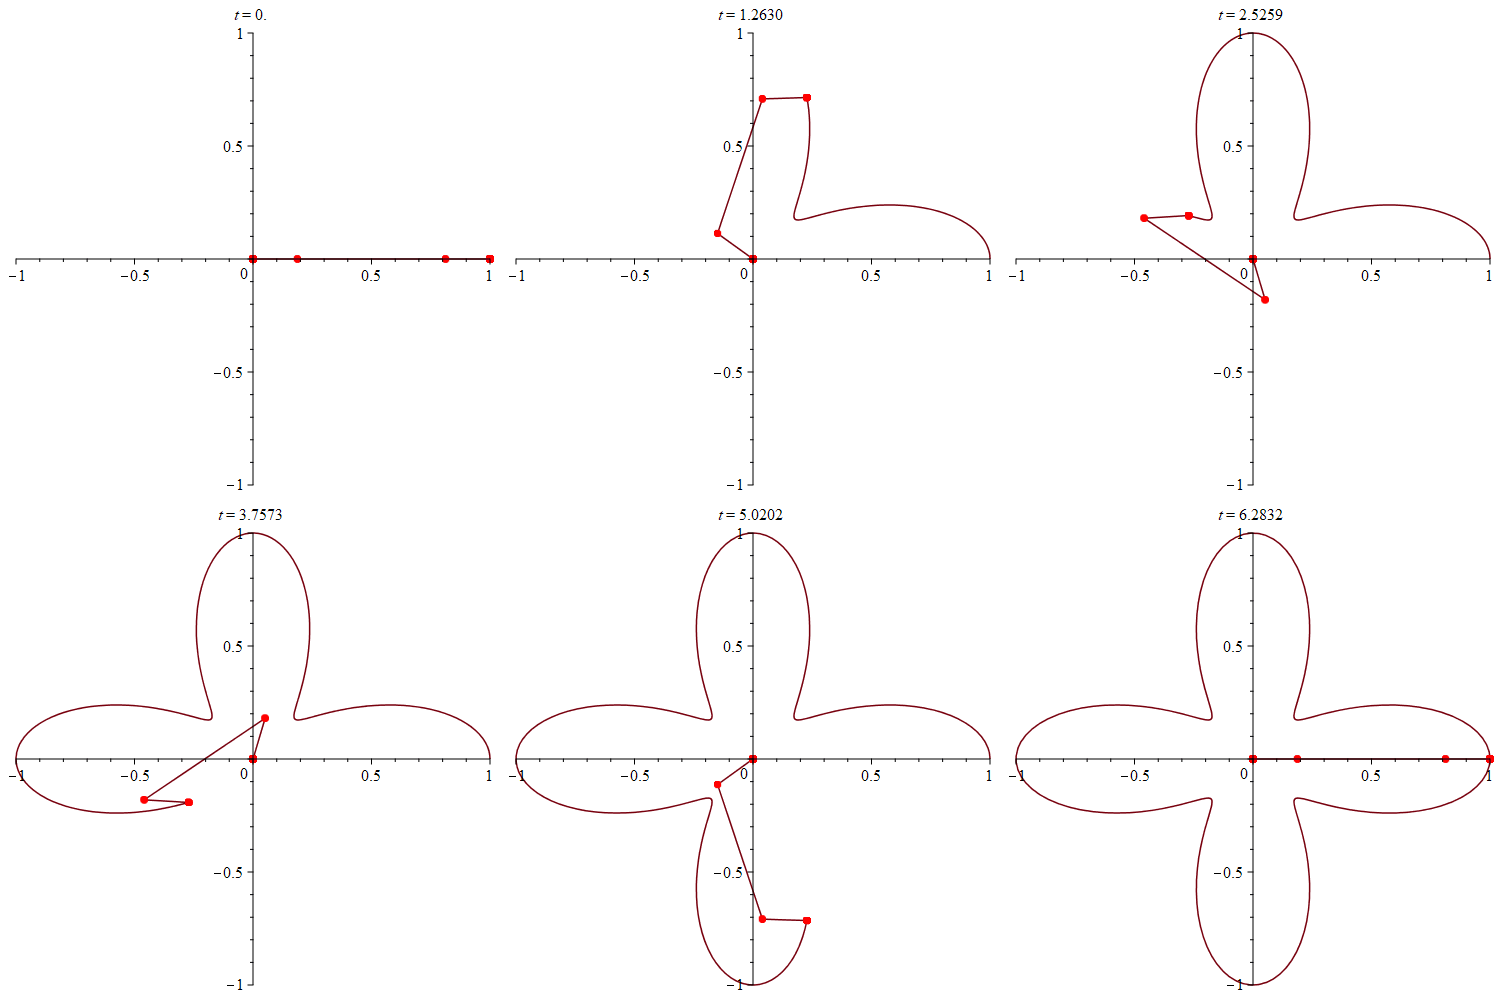
Fourth curve . . .
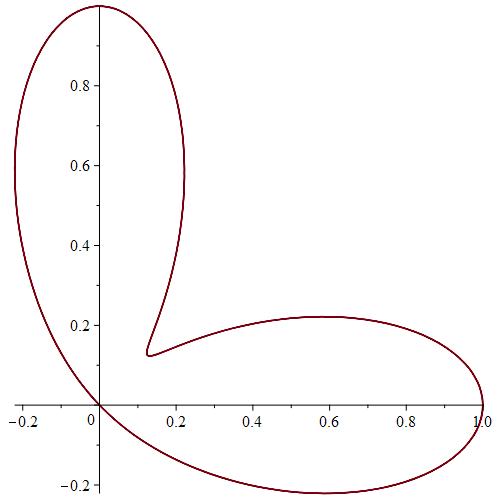
x = cos(t) (sin7(t)+cos7(t)) and y = sin(t) (sin7(t)+cos7(t)) where
π ≥ t ≥ 0.
Fifth curve . . .
x = cos(t)sin(3t)cos(3t) and y = sin(t)sin(3t)cos(3t)) where
2π ≥ t ≥ 0.
Sixth curve . . .
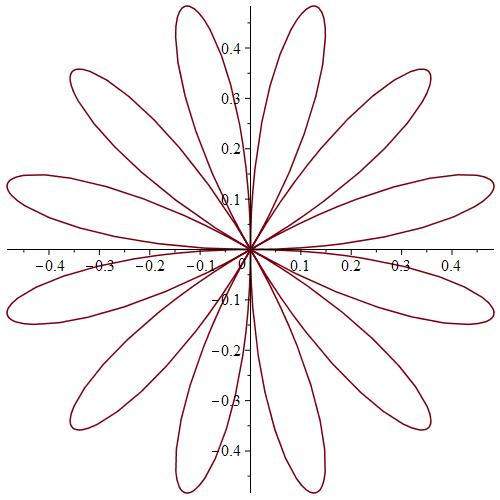
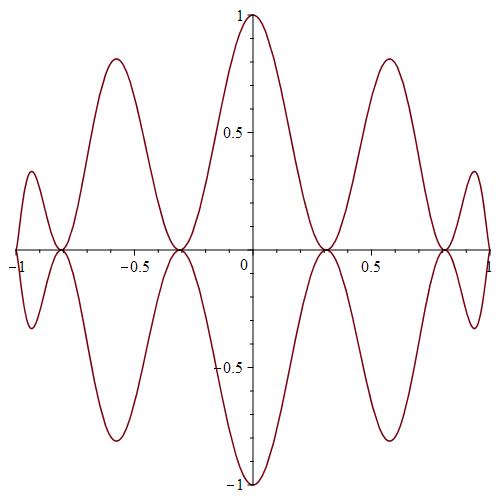
x = cos(t) and y = sin(t)sin2(5t) where
2π ≥ t ≥ 0.
Seventh curve . . .
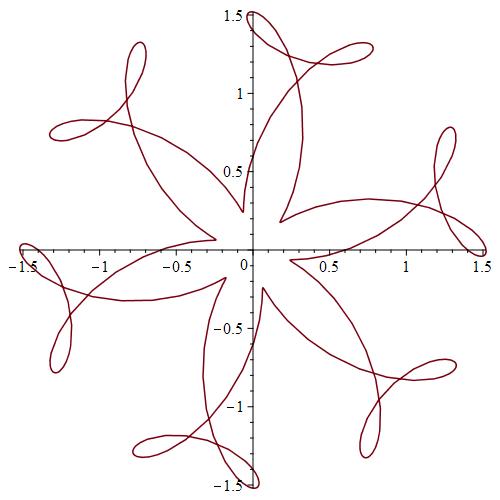
x = sin(t)+½cos(5t) + ¼sin(13t) and y =cos(t)+ ½sin(5t)+ ¼cos(13t) where
2π ≥ t ≥ 0.
Eigth curve . . .
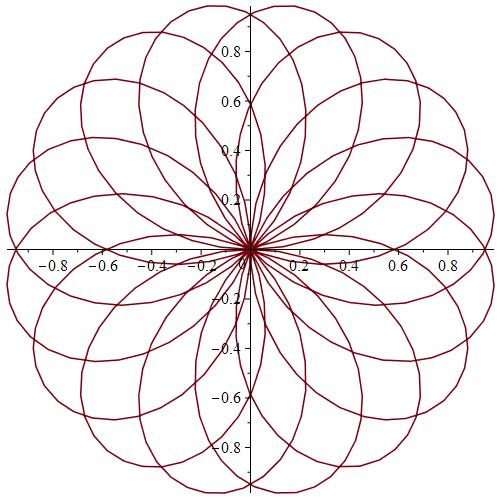
x = sin(8⁄5 t)cos(t) and y = sin(8⁄5 t)sin(t) where
10π ≥ t ≥ 0.
Ninth curve . . .
x =cos(t)cos(5t) and y = tsin(t) where
2π ≥ t ≥ 0.